
Senpi AI scored 543 Hyperliquid traders and found $20M in fixable leaks
543 Hyperliquid books scored: 60% under 50, 95% of open positions without a stop, and $20M in fixable leaks from fees, size and exits.
Originally published on X on October 13, 2026. Read the original on X.
Every book on Hyperliquid leaks.
The shape of the leaks curve depends on the size of the account.
"Winning" is all about managing size, exits, and fees.
Most traders are unaware of how fixable their leaks are.
AI can help you fix your leaks.
@senpi_ai read the whole Hyperliquid trader universe, then scored a sample of 543 accounts with AI Quant Desk, across every size band, including the top of the 7-day, 30-day and all-time PNL leaderboards, and hundreds of Hyperliquid traders who checked their own score with Senpi since Friday.
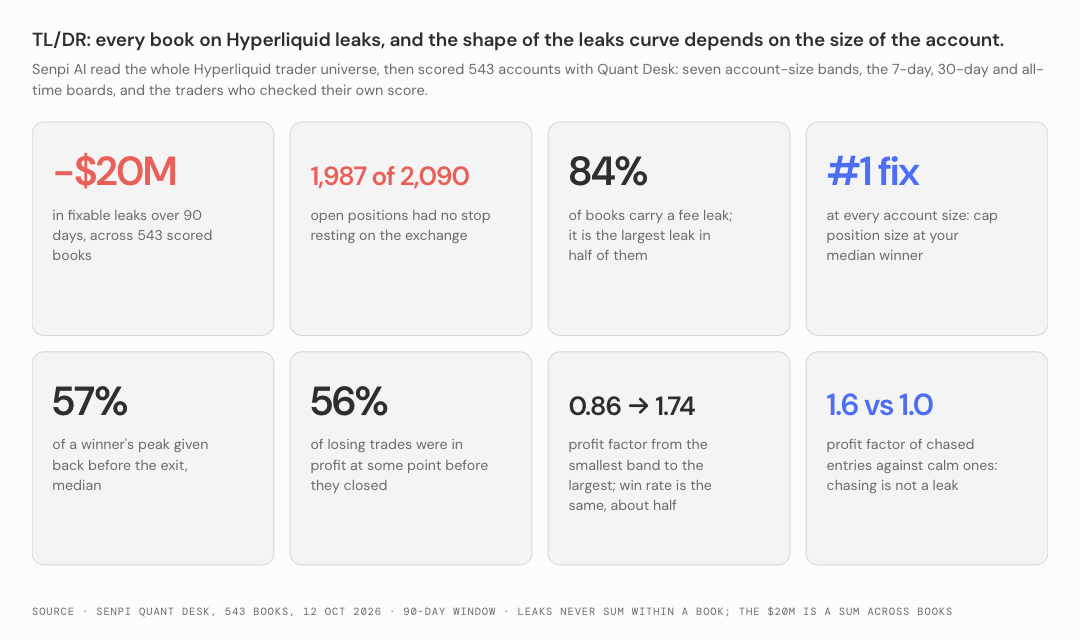
TL;DR
Across 543 books, the quantifiable fixable leaks add up to $20M over 90 days, about half of it in a handful of large books.
Fees are the leak almost every book has.
The trade that was too big is the one that costs the most.
The winner that was never locked is the one the big books pay for.
Win rate is the same at every size, about half; profit factor is not, 0.86 in the $5k–10k band and 1.74 above $1M.
The big accounts do not pick better, they lose smaller.In the median book, 56% of losing trades were in profit at some point before they closed.
Chasing is not a leak: entries after a 3% move did better than calm ones, profit factor 1.6 against 1.0.
Of the 2,090 open positions Senpi AI read, 1,987 had no stop on the exchange
All of it is measurable by AI, in about a minute, for any address.
How could you not know?
I. Quant Score is the Hyperliquid Credit Score. How could you not know yours?
Imagine going through life without knowing your credit score. Every lender you meet knows it. Your landlord knows it. The car dealership knows it. Your mortgage lender definitely knows it. You find out what it is at the exact moment it costs you something, and by then the number is already the price. That used to be normal. Then the number became free, it became yours, and a whole category of behaviour changed, because people fix what they can see.
Houses went the same way. Before the Zestimate, the only person who knew what your house was worth was the agent who wanted the listing. Zillow put a number on tens of millions of houses whether or not anyone asked. It was rough at first. It did not matter. The number existed, it was free, and it got better every time someone checked it against a sale. Nobody goes back to not knowing.
Trading on Hyperliquid is where credit was before the score. A trader knows their P&L, because the exchange shows it. Almost nobody knows their score: what share of their volume crossed the spread as a taker, how much of each winner's peak they gave back before they exited, how their losers compare with their winners in size and in hold time, whether the positions open right now have a stop on the exchange, and what the single rule that would have changed the most is worth in dollars. The chain records all of it. The counterparties with a data pipeline know it. The trader does not, and finds out the way the borrower used to, at the moment it costs them.
That is what the Quant Score is.
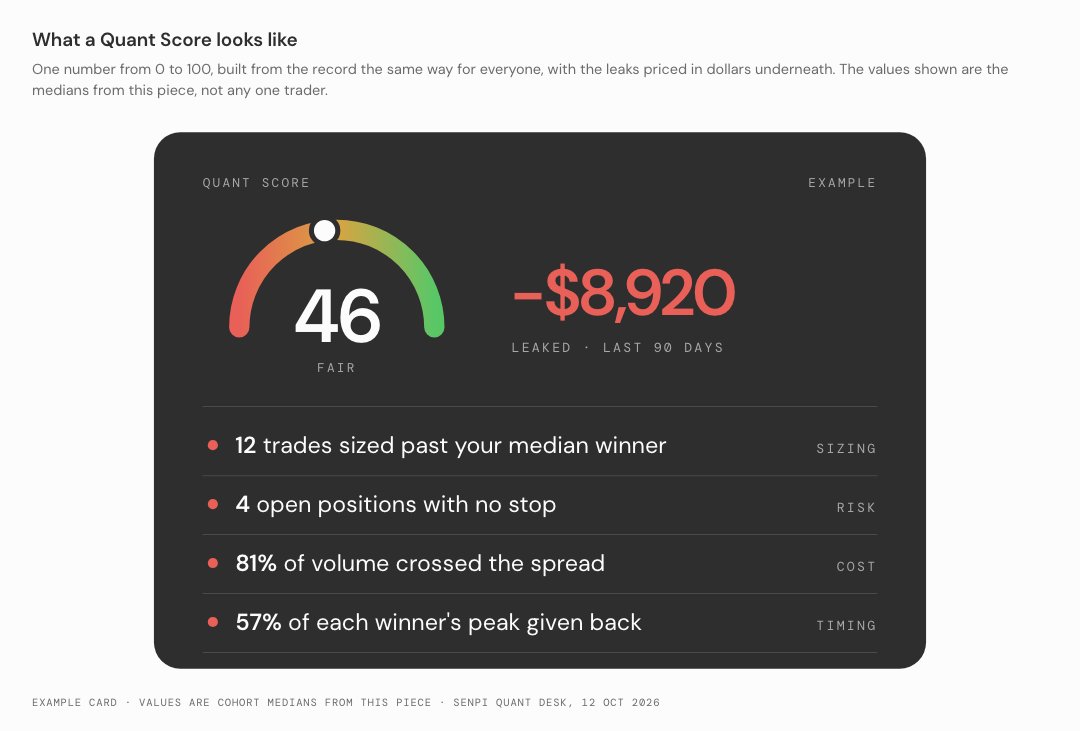
Figure 0. What a Quant Score looks like: one number from 0 to 100, with the leaks priced in dollars underneath. Example values are the medians from this piece.
A free number from 0 to 100 for any Hyperliquid address, built the way a credit score is built: from the record, by a program, the same way for everyone.
The program reads every fill in the wallet's history, the live book and the orders resting against it, the funding paid and collected, the transfers in and out. It scores six dimensions, risk management, consistency, timing, cost, market fit and sizing, and it prices every leak as a counterfactual: what the same trades would have returned under one changed rule. A trailing stop that locks a share of the peak. A resting order instead of a crossed one. A cap on size. An entry that waits for the move to settle. It compares the book with the proven cohort, the traders with more than a million dollars of realized profit, and with the hot cohort, the best of the last thirty days. Then it says which single change is worth the most.
The rest of this analysis is what the score says when you run it across the market, band by band.
II. The smaller the account, the more often it loses
Start with the Hyperliquid leaderboard itself. 47,116 accounts with their account value and their P&L over the day, the week, the month and all-time. It includes vaults and market makers and it does not say who is who, so read it as the whole room rather than as a cohort of traders.
18,768 of those accounts traded in the last thirty days.
Group them by size and two patterns are visible before you open a single book.
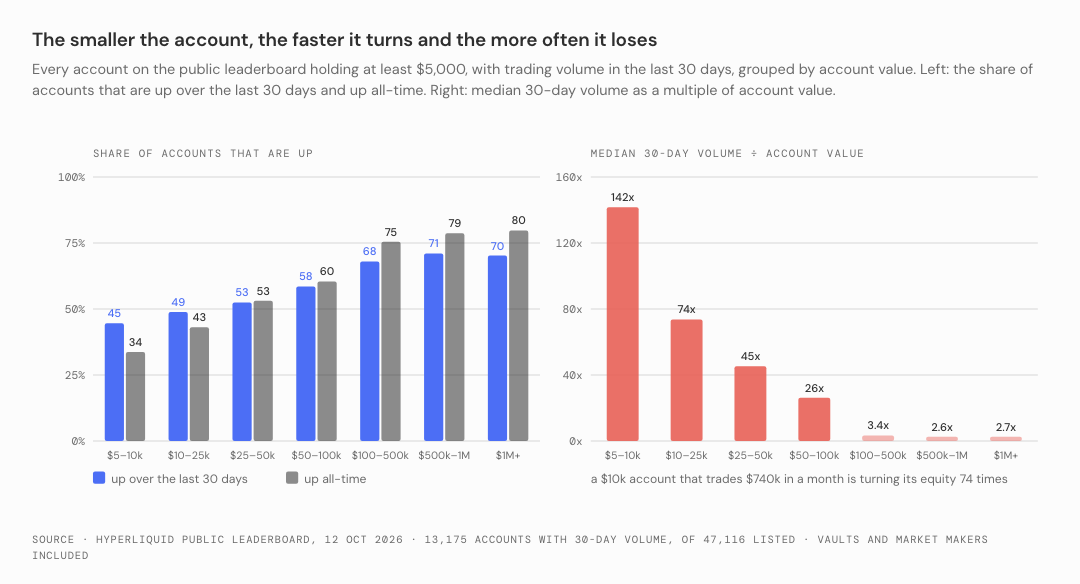
Figure 1. Share of accounts up over the last 30 days and all-time, and median monthly turnover, by account value. Public leaderboard, 12 October 2026.
The first is that the smaller the account, the more often it is down. Among accounts holding $5,000 to $10,000, 45% are up over the last thirty days and 34% are up all-time. Among accounts over $1M it is 70% and 80%. The accounts under $5,000, which include everyone who has already lost most of what they started with, have a median thirty-day return of minus 18%.
The second is that the smaller the account, the faster it turns. The median $5k–10k account traded 142 times its equity in the month: about a million dollars of volume on a $7,500 account. The median account over $100k traded about three times its equity. Turnover is not a leak by itself. But every dollar of volume pays a fee, and the fee depends on which side of the spread you were on. At the base taker rate of 0.045%, a million dollars of volume costs $456, which is 6% of a $7,500 account, every month, before a single trade goes wrong. At the base maker rate of 0.015% it costs $152.
Add it up across the room. In the last thirty days the accounts between $5,000 and $100,000 traded $46.9B and lost $39.9M between them. The accounts under $5,000 traded $30.5B and lost $21.6M. The accounts over $100,000 made $195M. Part of the third number is the first two, moved across the spread.
That is the whole room from the outside. It tells you who is losing. It does not tell anyone why, or what the one change worth making is.
For that you have to have AI analyze the books.
III. 543 desks: 60% score under 50
Then Senpi AI analyzed the books.
It ran the desk on 717 addresses: about a hundred from each of seven size bands, from $5k–10k up to $1M and more, sampled from accounts that traded at least $100,000 in the month; twenty-five from each of the top boards, 7-day, 30-day and all-time P&L; and the 47 addresses that traders pasted into senpi.ai since Friday. The desk declines some books. It will not score market-makers, it will not score an address with no perp activity in ninety days, and it will not score a book on more than sixty coins from a sample, which took out most of the pasted addresses and a hundred others. Six wallets whose balance today is a fraction of what they traded were moved out of their bands. That left 543 scored books, 475 of them across the seven bands.
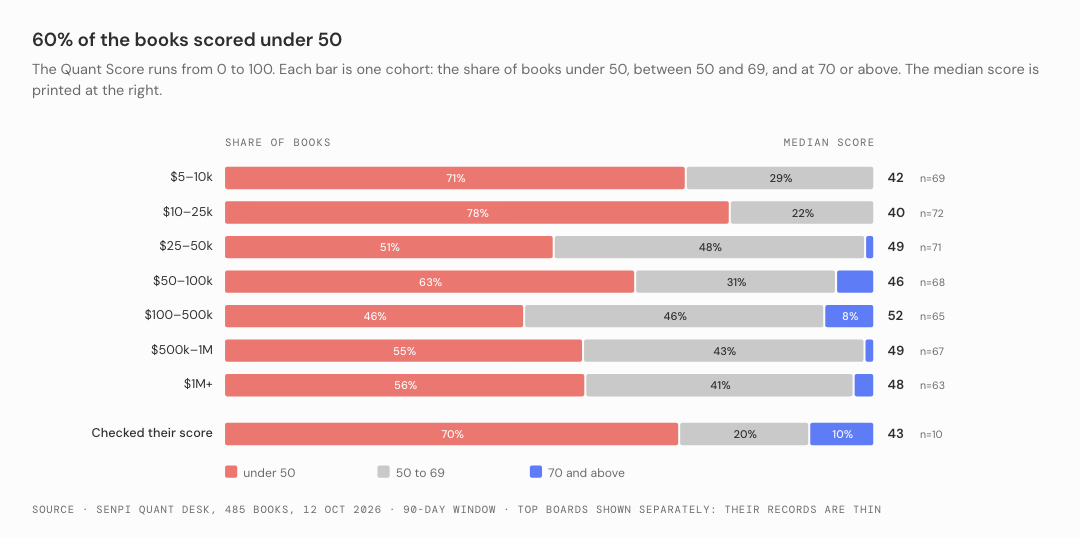
Figure 2. The Quant Score by cohort. The top boards are shown separately later; their records are thin.
The median score across the bands is 46.
60% of the books score under 50, and 3% score 70 or above.
The two smallest bands are the weakest, 42 and 40, with three books in four under 50.
Above $25k the medians sit between 46 and 52, and the P&L gradient is cleaner than the score gradient: 65% of the $5k–10k books lost money on their trades over the window, 41% of the $25k–50k books, 29% of the $1M+ books.
Win rate is not the difference.
The median book wins about half of its trades in every band, between 50% and 56%.
The difference is the profit factor, the dollars won per dollar lost, which runs from 0.86 in the smallest band to 1.74 in the largest, and the holding pattern behind it.
In every band the median book holds its winners for less time than its losers, 0.63 times as long at the median.
The $1M+ books come closest to even.
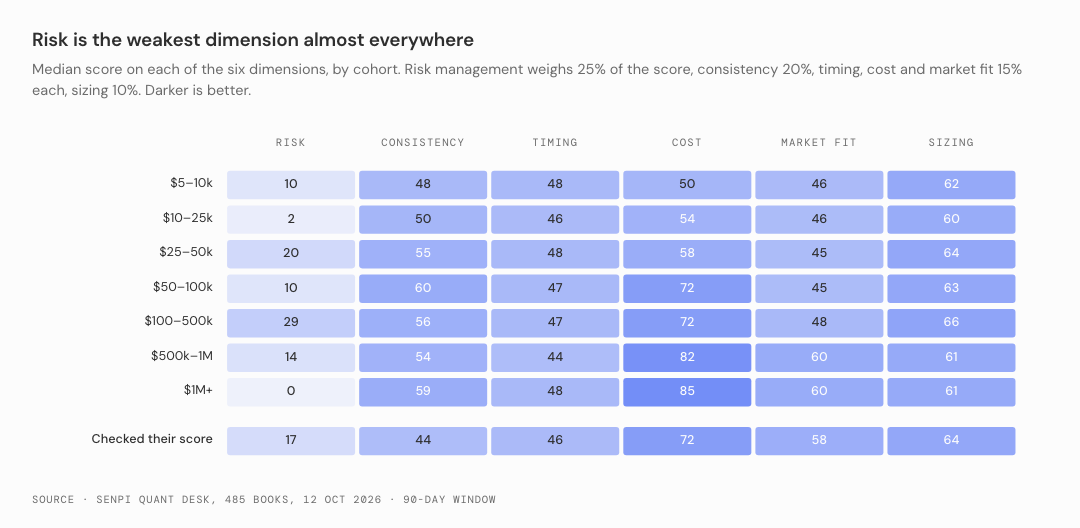
Figure 3. Median score on each of the six dimensions, by cohort. Darker is better.
Where the points go.
Risk management carries a quarter of the score and is close to zero in every band, 10 at the median. It is scored on the live book, and the live book has no stops, and on the hold ratio, and the median book holds its losers longer than its winners.
Cost is the other dimension that moves with size: 50 in the smallest band, 85 in the largest, which is the fee tiers and the maker share doing their work.
Consistency, timing and sizing are flat across size, in the 40s to 60s.
On those measures the big accounts are not better traders. They are cheaper, and they are capitalised to survive their own mistakes.
IV. The best single lever changes with the size of the account
For each book Senpi AI quant desk prices every leak it can measure as a counterfactual and names the one worth the most. The leaks overlap, because they are alternative fixes to the same trades, so they are never added within a book.
What comes out is one number per book: the single change, applied to every trade over 90 days, that would have kept the most, plus the fees, which are the one leak that can sit on top of another.
Across the 543 books those numbers sum to $20M, and about half of that sits in five large books. The median band book's number is about $1,900.
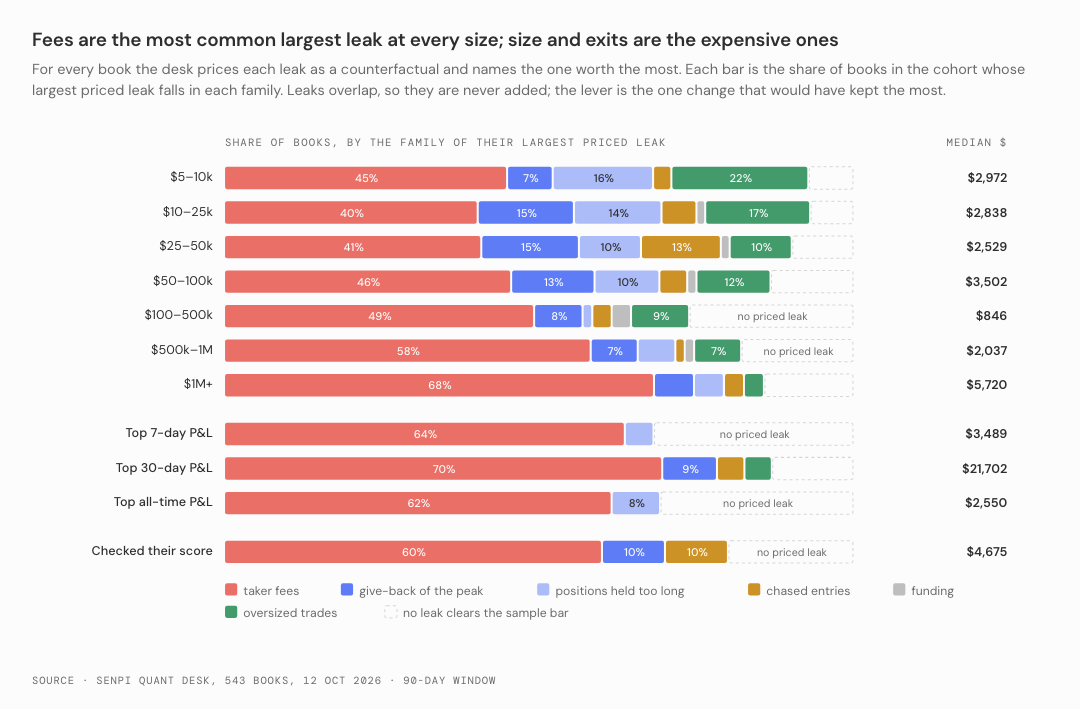
Figure 4. The family of each book's largest priced leak, by cohort, and the median dollar value of that lever over 90 days.
Fees are the leak almost every book has.
84% of the band books carry a priced taker-fee leak, and in half of them it is the largest one.
It is also the smallest in dollars: a median of $961 per book over 90 days.
The exit and size leaks are rarer and bigger. One book in five carries a priced give-back leak, worth a median $7,600.
One in five holds positions past the point where closing them was cheaper, worth $11,900.
One in four sizes trades beyond its own median winner, worth $9,500.
One in eight loses on chased entries, worth $4,300.
The fee leak scales the wrong way
$5k–10k band: fees over the window came to 18% of the account at the median, and 95% of the volume crossed the spread.
$10k–25k band: 8%.
Above $50k: 2% or less.
The small account pays for its impatience in the one currency it cannot afford.
The most common best rule at every size: cap position size at your median winner
It is the most common best rule in all seven bands, 71 of the 475 books.
The trailing stop that locks part of the peak is second in five of the seven, 33 books.
Skipping chased entries is third, 26 books.
Fees say where the money goes. The rules say the trade that was too big is the one that cost the most.
Two more things the levers say
The best change plus the fees would have recovered a median 24% of the band books' gross losses, and 31% in the $10k–25k band.
Chasing is not a leak by itself. In the median book, entries after a 3% move did better than the calm ones, a profit factor of 1.6 against 1.0. It is a leak in the specific books where it loses, and the desk prices it only there.
Cohort | Books | Score | Win rate | Profit factor | Taker share | Give-back | No-stop positions | Best single lever (share of books) | Lever $, median |
|---|---|---|---|---|---|---|---|---|---|
$5–10k | 69 | 42 | 50% | 0.86 | 95% | 56% | 87% | taker fees (45%) | $2,972 |
$10–25k | 72 | 40 | 51% | 1.04 | 85% | 59% | 88% | taker fees (40%) | $2,838 |
$25–50k | 71 | 49 | 52% | 1.35 | 80% | 59% | 88% | taker fees (41%) | $2,529 |
$50–100k | 68 | 46 | 50% | 1.41 | 84% | 55% | 89% | taker fees (46%) | $3,502 |
$100–500k | 65 | 52 | 53% | 1.47 | 64% | 56% | 93% | taker fees (49%) | $846 |
$500k–1M | 67 | 49 | 50% | 0.90 | 69% | 56% | 97% | taker fees (58%) | $2,037 |
$1M+ | 63 | 48 | 56% | 1.74 | 79% | 50% | 97% | taker fees (68%) | $5,720 |
Top 7-day P&L | 22 | 48 | 45% | 0.39 | 52% | 67% | 100% | taker fees (64%) | $3,489 |
Top 30-day P&L | 23 | 46 | 67% | 2.72 | 79% | 48% | 100% | taker fees (70%) | $21,702 |
Top all-time P&L | 13 | 47 | 54% | 0.77 | 34% | 64% | 100% | taker fees (62%) | $2,550 |
Checked their score | 10 | 43 | 42% | 0.83 | 88% | 69% | 100% | taker fees (60%) | $4,675 |
Table 1. The desks, cohort by cohort: medians, the no-stop share of open positions, and the best single lever. Source: Senpi Quant Desk, 543 books, 12 Oct 2026, 90-day window; market-maker-like books excluded.
V. Fees: 81% of volume crosses the spread
Every fill on Hyperliquid is one of two things.
A taker fill crosses the spread: you wanted it now, and you paid the base rate of 0.045% for the certainty.
A maker fill rested in the book until someone else crossed to it: you paid 0.015%, a third as much, and you took the risk that the market moved away before you were filled.
The difference is three basis points, which sounds like nothing until you remember turnover. At 142 times equity a month, three basis points is 4.3% of the account, every month.
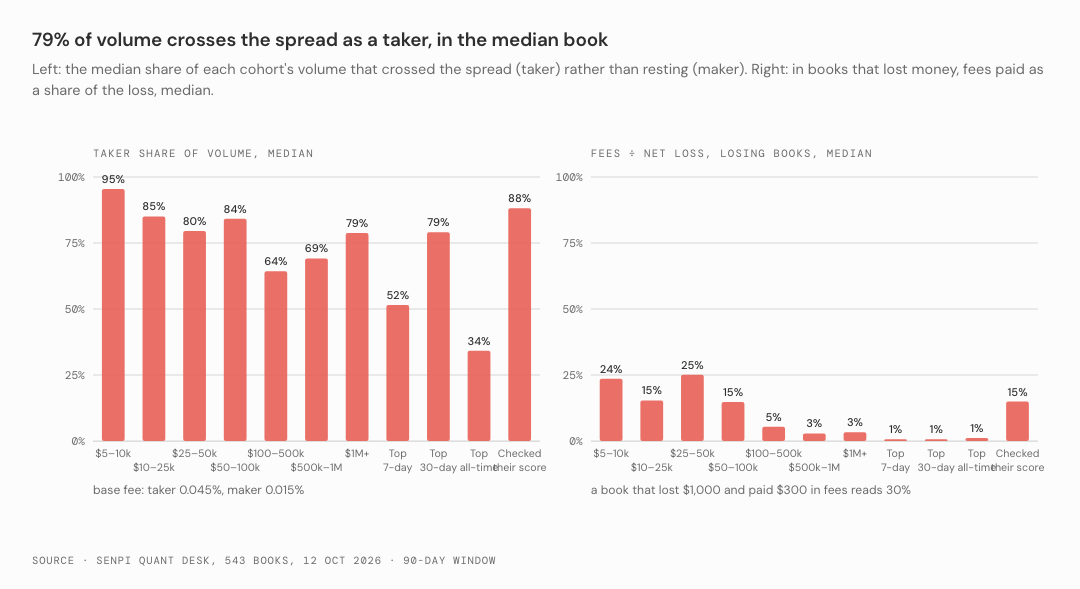
Figure 5. Left: the median share of each cohort's volume that crossed the spread. Right: in books that lost money, fees paid as a share of the loss, median.
How the AI Quant Desk prices the fee leak
It reads the taker share of every book from its fills.
The recoverable part is the fees actually paid, times the share that crossed, times the spread between crossing and resting.
It is priced per dex, because the builder dexes bill on a different schedule.
Rebates are earned and never counted.
What the 475 band books paid
In the median band book, 81% of the volume crossed the spread. In the $5k–10k band, 95%.
$3.8M of fees were paid on $14.0B of volume over 90 days.
$2.6M of that, 70%, is the part resting orders would have kept.
Among the books that lost money over the window, fees were 13% of the loss at the median.
In one losing book in eleven the fees were larger than the loss itself: the trading was close to break-even and the fees were the whole result.
Three honest caveats
Resting orders do not always fill. A book that only rests will miss some moves; the fee it saves is real, the trade it misses is also real, and the desk prices only the first.
Hyperliquid's own TP and SL orders fire as market orders, so they are taker by construction. A stop that fires on the exchange fills as a taker, and that is the price of being protected at 3am. Senpi's runtime goes one better where it can: its exit engine rests closes as maker orders when the runtime closes a position itself, and the floor that guards the position while you sleep is a stop resting on the exchange, which crosses the spread when it fires.
The entry is where the maker fee is won every time, which is why every strategy package senpi runs opens with a fee-optimized limit order: it rests at the touch first, and crosses only if the fill has not come within a set time.
VI. Exits: the median winner gives back 57% of its peak
Ask a trader for their worst habit and they will say they hold losers too long.
The record says the more expensive habit is what they do with winners.
How give-back is measured
For every completed trade the desk reads the hourly highs and lows across the hold and finds the best unrealized gain, the peak.
Give-back is the share of that peak that was gone by the time the trade closed.
What the band books gave back
The median winner gave back 57% of its peak.
In 56% of the books the median give-back was more than half.
In the median book, 56% of the losing trades had been in profit at some point before they closed.
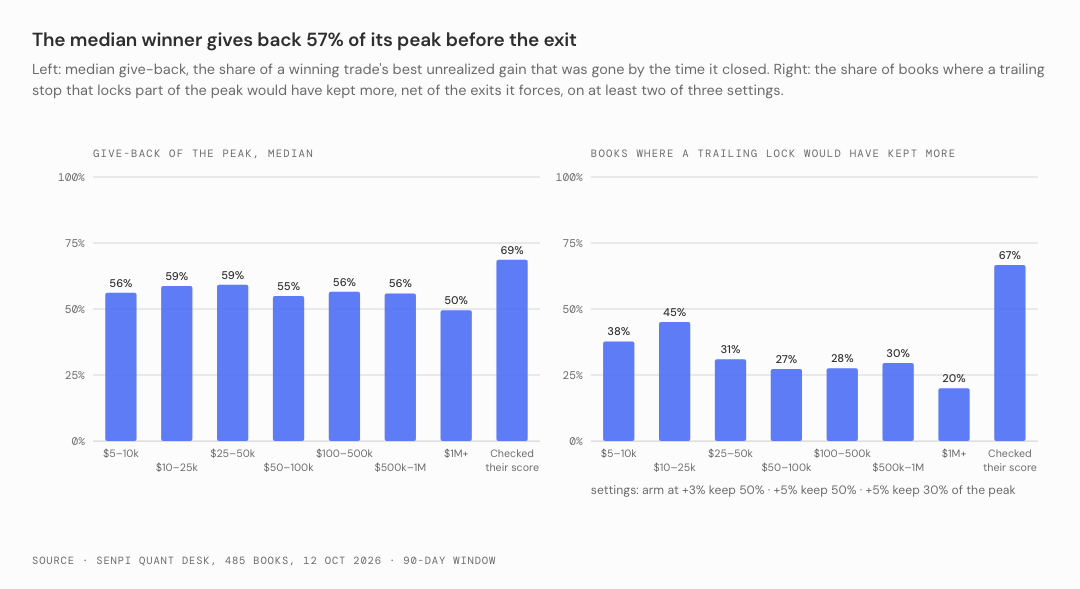
Figure 6. Left: median give-back of a winner's peak. Right: the share of books where a trailing stop that locks part of the peak would have kept more, net of the exits it forces, on at least two of three settings.
The trailing-lock counterfactual
The question: if a trailing stop had armed once the trade reached +3% or +5%, and had exited when the price gave back half, or 70%, of the peak, what would the same trades have returned?
It is charged where it costs. A trailing stop sells some winners before they become bigger winners, and the counterfactual pays for every one of those.
The bar is deliberately strict: ahead on two of three settings, net of every winner cut short.
A third of the band books with enough trades to test it clear that bar, 38% in the smallest band and 20% in the largest.
Where give-back is a priced leak, one book in five, it is worth a median $7,600 over 90 days.
The largest single case Senpi AI found was a book in the $500k–1M band that gave back 61% of its winners' peaks and would have kept about $630,000 more.
The best book Senpi AI scored, a 75 on the 30-day board with a profit factor of six, gave back only 17% of its peaks, and the lock was still worth $573,000, because of the size it runs.
This is the thing part two described as the two-phase stop: a floor on the exchange from the first tick, then tiers that lock a rising share of the high-water mark, every one a resting order that moves one way. It exists because this number exists. It has a cost, and the number above has already paid it.
VII. Protection: 95% of open positions have no stop
What the live books showed
Across the 475 band books, 1,292 perp positions were open at the moment of the read.
1,189 of them, 92%, had no stop order resting against them on the exchange: not a stop-market, not a stop-limit, not a trailing stop. A take-profit does not count, because it protects nothing.
119 of those positions were within 10% of their liquidation price with nothing covering them.
In the $500k–1M band it was 258 positions out of 267.
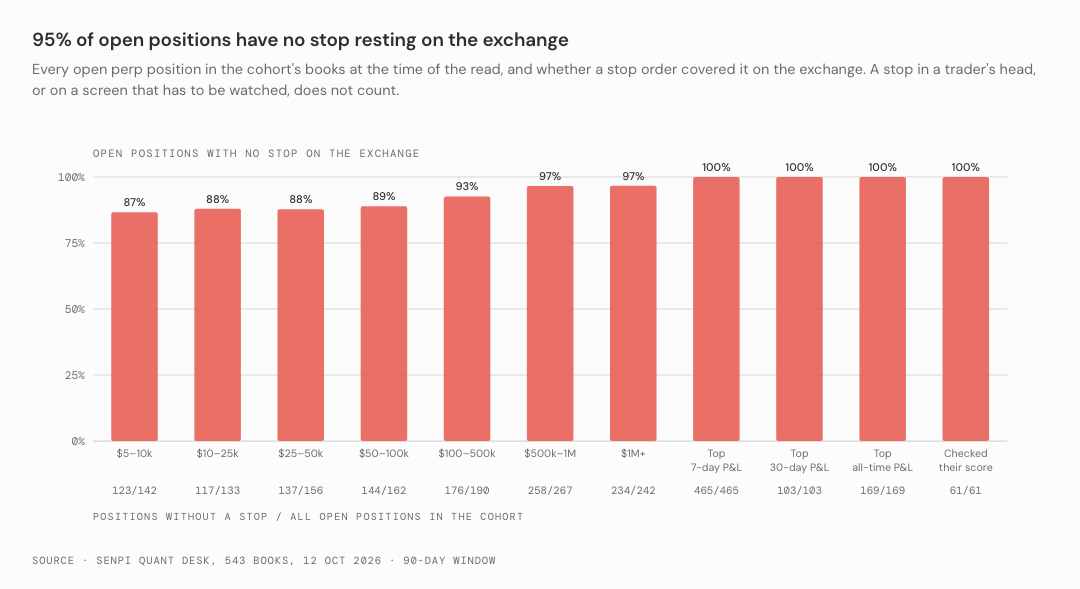
Figure 7. Open perp positions with no stop order resting on the exchange, by cohort.
Size does not change the habit
Large traders often run risk by other means, with hedges, with size, with a desk that watches. Small accounts mostly do not, and they run the same way.
In the $5k–10k band 123 of 142 open positions had no stop, and 24 of them were within 10% of liquidation.
1% of the band books took a liquidation inside the window; in the $100k–500k band it was 3%.
The three smaller leaks
The ones traders recognise fastest when they see them priced.
Size. The desk compares every trade with the trader's median winner. A cap at that size is the most common best rule in every band, and in 36% of the books the trades sized at more than twice the median lost money as a group. Where the leak is priced, one book in four, it is worth a median $9,500.
Overstaying. A losing position still open at 12, 24 or 48 hours that cost more than closing it would have. One book in five, median $11,900.
Chasing. An entry after a 3% move in the trade's direction over the previous 24 hours. Priced in one book in eight, median $4,300, and only there: in the median book the chased entries did better than the calm ones.
VIII. "Smart money" leaks too
The top boards are the leaderboard's own winners, the closest thing it has to smart money: the twenty-five largest P&Ls over 7 days, over 30 days, and all-time, with the exchange's own vault and the very largest volume books left out.
Measure | Top 7-day P&L | Top 30-day P&L | Top all-time P&L | The seven bands |
|---|---|---|---|---|
Books scored | 22 | 23 | 13 | 475 |
Days of record the desk saw, median | 8 | 14 | 36 | 33 |
Names with no perp trade in 90 days | 0 of 25 | 0 of 25 | 8 of 25 | none by construction |
Open positions with no stop on the exchange | 465 of 465 | 103 of 103 | 169 of 169 | 1,189 of 1,292 (92%) |
Taker share of volume, median | 52% | 79% | 34% | 81% |
Fee paid per side, median | 1.3 bps | 2.7 bps | 1.5 bps | 3.0 bps |
Profit factor, median | thin record | 2.7 | 0.77 | 1.13 |
Books that lost money on their trades | thin record | 22% | 31% | 45% |
Give-back of a winner's peak, median | thin record | 48% | 64% | 57% |
Largest single exit lever found | $541k | $573k | $85k | $631k |
Table 2. The three top P&L boards against the seven account-size bands. The 7-day board's trade-level measures are left blank because the desk saw only days of its record. Source: Senpi Quant Desk, 533 books, 12 Oct 2026, 90-day window; 25 sampled per board, the vault and the largest volume books left out.
Two things about reading them honestly
The biggest books fill thousands of times a day, and for those the desk sees days of record rather than months: on the 7-day board the median book was observed for eight days and two thirds were thin records, so for that board Senpi AI trusts the live book and the fee read and little else.
Eight of the twenty-five names on the all-time board had not traded a perp in ninety days. The all-time board is partly a museum.
What the live books say
Across the 53 top-board books with open positions, 737 positions were open at the read, and 737 had no stop resting on the exchange. Not one.
On the 7-day board, 465 of 465.
These are traders who run risk with size and attention, and the record says the attention is doing all of the work.
What the fees say
The best books rest more. The 7-day and all-time names cross the spread for 52% and 34% of their volume at the median, against 81% in the bands, and pay 1.3 and 1.5 basis points a side where the bands pay 3.0.
The 30-day board is the exception, 79% taker and 2.7 basis points, and it pays for it: $1.27M of fees across 23 books in 90 days, three quarters of it recoverable.
At this size the fee leak stops being small. The median taker-fee lever on the 30-day board is $28,000, and the largest is $199,000 on a single book.
And the exits
The 30-day board is the strongest trading Senpi AI scored: a median win rate of 67%, a profit factor of 2.7, and winners that give back 48% of their peak against 57% in the bands.
Even there the lock has a price tag. The two largest exit levers on this board: $573,000 on a book that scores 75 and gives back only 17%, and $552,000 on a scalper with a profit factor of three over 151 trades.
The all-time names that still trade look like the bands over the last 90 days: a median profit factor of 0.77, and 31% losing on their trades.
A board is a record of what happened. A score is a read of what is happening.
IX. Check your own score: it is free, and hundreds of Hyperliquid traders already have
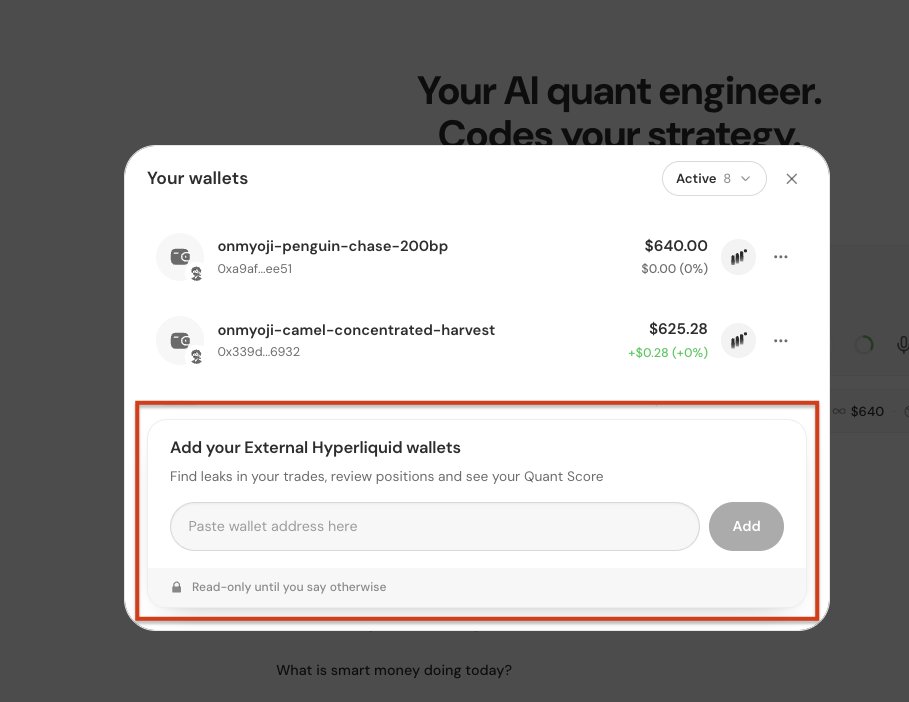
Checking your own Quant Score is free and takes about a minute. Paste your Hyperliquid address at senpi.ai and your agent reads every fill, scores the book on the six dimensions, prices the leaks, and compares you with the best traders on the exchange: the proven cohort, with more than a million dollars of realized profit each, and the hot cohort, the best of the last thirty days.
X. Improve, protect, automate
A score is not advice. It is a mirror with a number on it, and the number comes from the same program for everyone.
Here is what Senpi AI has watched people do with it, in order.
Improve. Find the one lever and fix that one thing. For most small accounts it is the order type: rest first, cross when you must. For many it is a cap on size at the median winner, which is a rule you can write on a card. For the large accounts it is the exit.
Protect. Put the exit on the exchange, where it works while you sleep. Or for fee optimized trailing stops, have Senpi runtime manage it for you.
Automate. When the rules are the ones you would follow at 3am anyway, let the runtime follow them, and keep the model out of the order.
Coming very soon:
>> You'll be able to have Senpi AI add maker-fee-optimized trailing stop losses on any position, no matter where it originated.
Next steps:
Paste any Hyperliquid address at senpi.ai. The score is free, it takes about a minute, and it is the same program whether the account holds five thousand dollars or fifty million.
Notes and method
As of 12 October 2026. Leaderboard: the public Hyperliquid leaderboard, 47,116 accounts with day, week, month and all-time windows; it includes vaults and market makers. Active means volume in the last 30 days. Bands are by account value on the day of the read.
Desks: senpi quant desk, 90-day window, on 717 addresses: about a hundred per band, sampled from accounts with at least $100,000 of 30-day volume; 25 per top board (7-day, 30-day and all-time P&L), leaving out the exchange's vault and books over $5B of monthly volume; and the 47 addresses pasted into senpi.ai between 9 and 13 October. 565 returned a desk, 549 carried a score, 543 are used: six wallets whose window P&L or average equity was more than twenty times today's balance were moved out of their bands. 78 addresses had no perp activity in ninety days, 65 touched more than sixty coins, which the desk will not score from a sample, one failed on a rate-limited read and eight on other errors. No market maker surfaced among the scored books; a rebate-earning fee rate is the test.
The headline figure, $20M, is the sum over the 543 books of each book's best single change plus its fees over 90 days. Sums across books are legitimate; sums within a book are not. About half of the total sits in five large books; the median band book's figure is about $1,900.
Thin records: the desk reads the most recent fills of a book, which for the largest books is days rather than months. The equity series of several very large books did not reconcile with their flows, so for the top boards the piece uses the live book, the fee read and the leaderboard's own P&L, not the desk's drawdown or ledger.
Score: six dimensions, weighted risk 25%, consistency 20%, timing 15%, cost 15%, market fit 15%, sizing 10%. Risk is scored on the live book's stop coverage, liquidation distance, the hold ratio, margin use and drawdown.
Protection: a stop is a resting, reduce-only stop-market, stop-limit or trailing-stop order on the exit side of the same coin. A take-profit is not a stop. "No stop" means no such order covered any of the position's size at the read.
Give-back = (best unrealized gain − realized) ÷ best unrealized gain, for winners, from hourly highs and lows over the hold. Chased = an entry after a move of at least 3% in the trade's direction over the previous 24 hours.
Counterfactuals are priced on the exposure that existed and charged where they cost: every winner a rule cuts short counts against it, and a setting needs at least five engaged trades. Time cut: exit a losing position at the first candle past 12, 24 or 48 hours. Trailing lock: once the peak reaches +3% or +5%, exit when the price gives back 50% or 70% of it. Size cap: trades larger than 1.5× the median winner, scaled to the median. "Ahead on two of three settings" is this piece's bar; the desk itself quotes a family's lower median and drops any family that hands back more than 85% of what it saves.
Leaks never sum. They are alternative fixes to the same trades. The one number worth quoting is the best single change applied to every trade, plus fees, which are the one leak independent of the exit rule.
Fee recoverable = fees paid × the taker share of those fees × the spread between crossing and resting, per dex. Base schedule: taker 0.045%, maker 0.015%; volume tiers lower both.
Anonymity: no address, user or account is identified. Every figure in the piece is a cohort median or count; the single-book figures in sections VI and VIII are rounded and unattributed.
Senpi can’t place a stop in an external wallet you add, such as MetaMask: it reads those wallets but can’t trade them, so the desk names the positions without one. Its protection applies to the strategies it runs, where the runtime owns the exits.
Frequently asked questions
What is the Quant Score?
A number from 0 to 100 for any Hyperliquid address, computed the same way for everyone from the wallet's public record: every fill, the live book and resting orders, funding and transfers. It scores six dimensions, risk management 25%, consistency 20%, timing 15%, cost 15%, market fit 15% and sizing 10%, and prices each leak in dollars. The median score across the 475 sampled band books was 46.
How much do Hyperliquid traders lose to fixable leaks?
Across 543 scored books, each book's best single change plus its fees adds up to $20M over the 90 days to 12 October 2026. About half of that sits in five large books; the median band book's figure is about $1,900.
Do Hyperliquid traders use stop losses?
Mostly not. Of 2,090 open positions read on 12 October 2026, 1,987 had no stop order resting on the exchange. In the seven account-size bands it was 1,189 of 1,292 positions, or 92%, and on the top 7-day P&L board 465 of 465.
Do bigger Hyperliquid accounts win more often?
No. The median book wins between 50% and 56% of its trades at every account size. What changes is the profit factor, the dollars won per dollar lost: 0.86 in the $5k–10k band and 1.74 above $1M.
What is the most common fix for a Hyperliquid trader?
Cap position size at your median winner. It was the most common best single rule in all seven size bands, 71 of 475 books, ahead of a trailing stop that locks part of the peak (33 books) and skipping chased entries (26). Fees are the most common leak: 84% of the band books carry a priced taker-fee leak.